Testing and debugging an application
For simplicity, this guide will refer to both samples and applications as “applications”.
Follow the instructions in the testing section of the application’s documentation to make sure that the application runs as expected.
Information about the current state of the application is usually provided through the LEDs or through UART, or through both. See the user interface section of the application’s documentation for description of the LED states or available UART commands.
How to connect with nRF Connect for VS Code extension
The nRF Connect for VS Code extension is a complete IDE for developing applications for nRF91, nRF53 and nRF52 Series devices. The extension pack includes nRF Terminal, which is an integrated serial port and RTT terminal to connect to your board. For detailed instructions, see the nRF Terminal documentation on the nRF Connect for Visual Studio Code documentation site.
Note
The nRF Connect for VS Code extension lets you build and program with custom options. For more information, read about the advanced Custom launch and debug configurations and Application-specific flash options in the extension documentation.
How to connect with PuTTY
To see the UART output, connect to the development kit with a terminal emulator, for example, PuTTY.
Connect with the following settings:
Baud rate: 115200
8 data bits
1 stop bit
No parity
HW flow control: None
If you want to send commands through UART, make sure to configure the required line endings and turn on local echo and local line editing:
UART can also be used for logging purposes as one of the logging backends.
How to use RTT
To view the logging output using Real Time Transfer (RTT), modify the configuration settings of the application to override the default UART console:
CONFIG_USE_SEGGER_RTT=y
CONFIG_RTT_CONSOLE=y
CONFIG_UART_CONSOLE=n
SEGGER’s J-Link RTT can also be used for logging purposes as one of the logging backends.
Note
SEGGER’s J-Link RTT is part of the J-Link Software and Documentation Pack. You must have this software installed on your platform to use RTT.
Connecting using RTT
To run RTT on your platform, complete the following steps:
From the J-Link installation directory, open the J-Link RTT Viewer application:
On Windows, the executable is called
JLinkRTTViewer.exe.On Linux, the executable is called
JLinkRTTViewerExe.
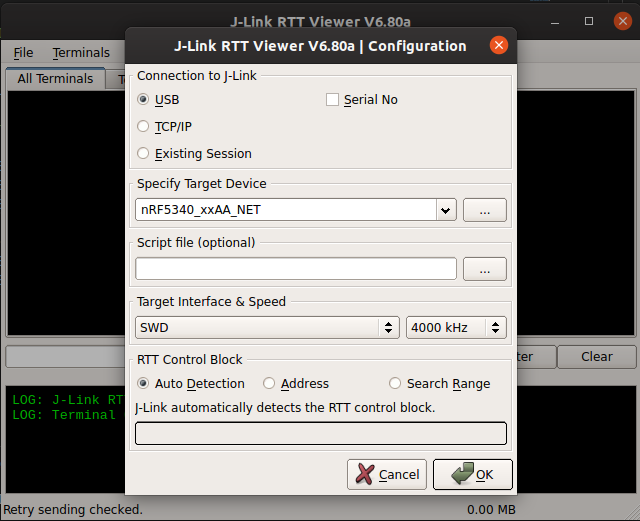
Select the following options to configure your connection:
Connection to J-Link: USB
Target Device: Select your IC from the list
Target Interface and Speed: SWD, 4000 KHz
RTT Control Block: Auto Detection

Click OK to view the logging output from the device.
How to connect with LTE Link Monitor
To connect to nRF9160-based kits (for example, the nRF9160 DK or Nordic Thingy:91), you can also use LTE Link Monitor, which is implemented in nRF Connect for Desktop. This application is used to establish LTE communication with the nRF9160 modem through AT commands, and it also displays the UART output.
To connect to the nRF9160-based kit with LTE Link Monitor, perform the following steps:
Launch the LTE Link Monitor app.
Note
Make sure that Automatic requests (in the SETTINGS section) is enabled in LTE Link Monitor.
Connect the nRF9160-based kit to the PC with a USB cable.
Power on the nRF9160-based kit.
Click Select Device and select the particular kit entry from the drop-down list in the LTE Link Monitor.
Observe that the LTE Link monitor app starts AT communication with the modem of the nRF9160-based kit and shows the status of the communication in the display terminal. The app also displays any information that is logged on UART.
Note
In the case of nRF9160 DK, the reset button must be pressed to restart the device and to start the application.
Debugging an application
To debug an application, set up the debug session as described in Debugging an application in the nRF Connect for VS Code extension documentation.
If you use a multi-core SoC, for example from the nRF53 Series, and you only wish to debug the application core firmware, a single debug session is sufficient. To debug the firmware running on the network core, you need to set up two separate debug sessions: one for the network core and one for the application core. When debugging the network core, the application core debug session runs in the background and you can debug both cores if needed.
Complete the following steps to start debugging the network core:
Set up sessions for the application core and network core as mentioned in Debugging an application.
Select the appropriate CPU for debugging in each session, corresponding to the application core and the network core of your SoC, respectively.
Once both sessions are established, execute the code on the application core.
The startup code releases the
NETWORK.FORCEOFFsignal to start the network core and allocates the necessary GPIO pins for it.Start code execution on the network core in the other debug session.
If you want to reset the network core while debugging, make sure to first reset the application core and execute the code.
Debugging secure and non-secure firmware
When using an _ns build target, by default you can only debug firmware in the non-secure part of the application core firmware.
To debug firmware running in the secure part, you need to build Trusted Firmware-M with debug symbols enabled and load the symbols during the debugging session.
To build Trusted Firmware-M with debug symbols, set the CONFIG_TFM_CMAKE_BUILD_TYPE_RELWITHDEBINFO Kconfig option.
To load the Trusted Firmware-M debug symbols in the GDB tool, run the following command and answer y if prompted by the tool:
(gdb) add-symbol-file build/tfm/bin/tfm_s.elf
For more information about the GDB tool, see Debug tools.
Debug configuration
When you are following the Debugging an application process in the nRF Connect for VS Code extension and select the Enable debug options checkbox in the Add Build Configuration page, the following Kconfig options are set to y when you add the configuration:
CONFIG_DEBUG_OPTIMIZATIONS- This option limits the optimizations made by the compiler to only those that do not impact debugging.CONFIG_DEBUG_THREAD_INFO- This option adds additional information to the thread object, so that the debugger can discover the threads. This will work for any debugger.
You can also set these options to y manually.
There are many more Kconfig options for debugging that are specific to different modules.
For details, see the respective documentation pages of the modules.
Debug build types
Some applications and samples provide a specific build type that enables additional debug functionalities. You can select build types when you are configuring the build settings.
Debug logging
You can use logging system to get more information about the state of your application. Logs are integrated to many various modules and subsystems in the nRF Connect SDK and Zephyr. These logs are visible once you configure logger for your application.
You can also configure log level per logger module, for example to get more information about a given subsystem. See Logging in nRF Connect SDK for details on how to enable and configure logs.
Debug libraries
The nRF Connect SDK also provides several libraries and drivers for debugging different components. For example:
You can use Debug libraries for any of your applications, for example to measure CPU load or trace hardware peripheral events on pins.
You can use nRF Profiler to measure performance and debug applications without introducing big performance overhead. This option requires introducing additional code changes: your application must register profiler events and log their occurrences.
When working with the SEGGER J-Link with the RTT feature, you can use the Ethernet over RTT driver, which is useful for handling data transfer.
The Thread protocol implementation offers pre-built libraries with debug symbols.
The Zigbee protocol implementation offers Zigbee ZBOSS OSIF and Zigbee shell with custom Kconfig options that you can set for debugging.
Debugging stack overflows
One of the potential root causes of fatal errors in an application are stack overflows. Read the Stack Overflows section on the Fatal Errors page in the Zephyr documentation to learn about stack overflows and how to debug them.
You can also use a separate module to make sure that the stack sizes used by your application are big enough to avoid stack overflows. One of such modules is for example Zephyr’s Thread analyzer.
Debug tools
The main recommended tool for debugging in the nRF Connect SDK is the GNU Project Debugger (GDB tool).
When working with the nRF Connect for VS Code extension, use the GDB tool after adding the required Kconfig options to the
prj.conffile.If you are working from the command line, you can use west with the GDB tool. For details, read the Debugging with west debug section on the Building, Flashing and Debugging page in the Zephyr documentation.
A useful tool for debugging the communication over Bluetooth and mesh networking protocols, such as Thread or Zigbee, is the nRF Sniffer for 802.15.4. The nRF Sniffer allows you to look into data exchanged over-the-air between devices.
