Tracing
Overview
The tracing feature provides hooks that permits you to collect data from your application and allows tools running on a host to visualize the inner-working of the kernel and various subsystems.
Every system has application-specific events to trace out. Historically, that has implied:
Determining the application-specific payload,
Choosing suitable serialization-format,
Writing the on-target serialization code,
Deciding on and writing the I/O transport mechanics,
Writing the PC-side deserializer/parser,
Writing custom ad-hoc tools for filtering and presentation.
An application can use one of the existing formats or define a custom format by overriding the macros declared in include/tracing/tracing.h.
-
group
tracing_apis Tracing APIs.
Defines
-
sys_trace_thread_switched_out()¶ Called before a thread has been selected to run.
-
sys_trace_thread_switched_in()¶ Called after a thread has been selected to run.
-
sys_trace_thread_priority_set(thread)¶ Called when setting priority of a thread.
- Parameters
thread: Thread structure
-
sys_trace_thread_create(thread)¶ Called when a thread is being created.
- Parameters
thread: Thread structure
-
sys_trace_thread_abort(thread)¶ Called when a thread is being aborted.
- Parameters
thread: Thread structure
-
sys_trace_thread_suspend(thread)¶ Called when a thread is being suspended.
- Parameters
thread: Thread structure
-
sys_trace_thread_resume(thread)¶ Called when a thread is being resumed from suspension.
- Parameters
thread: Thread structure
-
sys_trace_thread_ready(thread)¶ Called when a thread is ready to run.
- Parameters
thread: Thread structure
-
sys_trace_thread_pend(thread)¶ Called when a thread is pending.
- Parameters
thread: Thread structure
-
sys_trace_thread_info(thread)¶ Provide information about specific thread.
- Parameters
thread: Thread structure
-
sys_trace_thread_name_set(thread)¶ Called when a thread name is set.
- Parameters
thread: Thread structure
-
sys_trace_isr_enter()¶ Called when entering an ISR.
-
sys_trace_isr_exit()¶ Called when exiting an ISR.
-
sys_trace_isr_exit_to_scheduler()¶ Called when exiting an ISR and switching to scheduler.
-
sys_trace_void(id)¶ Can be called with any id signifying a new call.
- Parameters
id: ID of the operation that was started
-
sys_trace_end_call(id)¶ Can be called with any id signifying ending a call.
- Parameters
id: ID of the operation that was completed
-
sys_trace_idle()¶ Called when the cpu enters the idle state.
-
sys_trace_semaphore_init(sem)¶ Trace initialisation of a Semaphore.
- Parameters
sem: Semaphore object
-
sys_trace_semaphore_take(sem)¶ Trace taking a Semaphore.
- Parameters
sem: Semaphore object
-
sys_trace_semaphore_give(sem)¶ Trace giving a Semaphore.
- Parameters
sem: Semaphore object
-
sys_trace_mutex_init(mutex)¶ Trace initialisation of a Mutex.
- Parameters
mutex: Mutex object
-
sys_trace_mutex_lock(mutex)¶ Trace locking a Mutex.
- Parameters
mutex: Mutex object
-
sys_trace_mutex_unlock(mutex)¶ Trace unlocking a Mutex.
- Parameters
mutex: Mutex object
-
Different formats, transports and host tools are avialable and supported in Zephyr.
In fact, I/O varies greatly from system to system. Therefore, it is instructive to create a taxonomy for I/O types when we must ensure the interface between payload/format (Top Layer) and the transport mechanics (bottom Layer) is generic and efficient enough to model these. See the I/O taxonomy section below.
Serialization Formats
Common Trace Format (CTF) Support
Common Trace Format, CTF, is an open format and language to describe trace formats. This enables tool reuse, of which line-textual (babeltrace) and graphical (TraceCompass) variants already exist.
CTF should look familiar to C programmers but adds stronger typing. See CTF - A Flexible, High-performance Binary Trace Format.
CTF allows us to formally describe application specific payload and the serialization format, which enables common infrastructure for host tools and parsers and tools for filtering and presentation.
A Generic Interface
In CTF, an event is serialized to a packet containing one or more fields. As seen from I/O taxonomy section below, a bottom layer may:
perform actions at transaction-start (e.g. mutex-lock),
process each field in some way (e.g. sync-push emit, concat, enqueue to thread-bound FIFO),
perform actions at transaction-stop (e.g. mutex-release, emit of concat buffer).
CTF Top-Layer Example
The CTF_EVENT macro will serialize each argument to a field:
/* Example for illustration */
static inline void ctf_top_foo(uint32_t thread_id, ctf_bounded_string_t name)
{
  CTF_EVENT(
    CTF_LITERAL(uint8_t, 42),
    thread_id,
    name,
    "hello, I was emitted from function: ",
    __func__  /* __func__ is standard since C99 */
  );
}
How to serialize and emit fields as well as handling alignment, can be done internally and statically at compile-time in the bottom-layer.
The CTF top layer is enabled using the configuration option
CONFIG_TRACING_CTF and can be used with the different transport
backends both in synchronous and asynchronous modes.
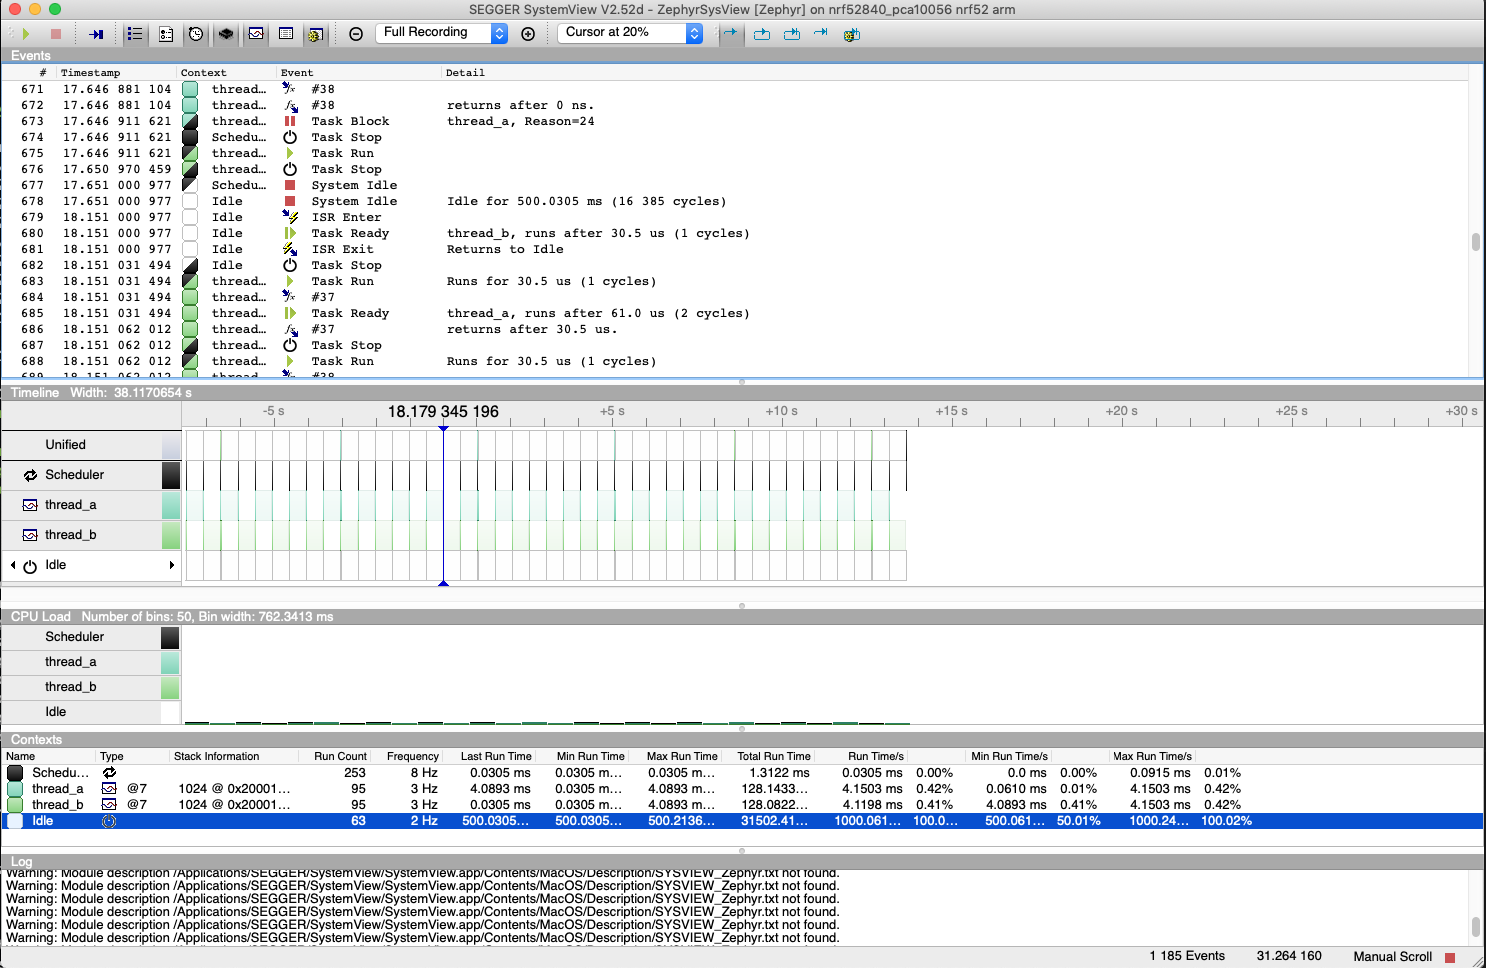
SEGGER SystemView Support
Zephyr provides built-in support for SEGGER SystemView that can be enabled in any application for platforms that have the required hardware support.
The payload and format used with SystemView is custom to the application and relies on RTT as a transport. Newer versions of SystemView support other transports, for example UART or using snapshot mode (both still not supported in Zephyr).
To enable tracing support with SEGGER SystemView add the configuration option
CONFIG_SEGGER_SYSTEMVIEW to your project configuration file and set
it to y. For example, this can be added to the
Synchronization Sample to visualize fast switching between threads.
SystemView can also be used for post-mortem tracing, which can be enabled with
CONFIG_SEGGER_SYSVIEW_POST_MORTEM_MODE. In this mode, a debugger can
be attached after the system has crashed using west attach after which the
latest data from the internal RAM buffer can be loaded into SystemView:
CONFIG_STDOUT_CONSOLE=y
# enable to use thread names
CONFIG_THREAD_NAME=y
CONFIG_SEGGER_SYSTEMVIEW=y
CONFIG_USE_SEGGER_RTT=y
CONFIG_TRACING=y
# enable for post-mortem tracing
CONFIG_SEGGER_SYSVIEW_POST_MORTEM_MODE=n
CPU Stats
A special tracing format which provides information about percentage of CPU usage based on tracing hooks for threads switching in and out, interrupts enters and exits (only distinguishes between idle thread, non idle thread and scheduler).
Enable this format with the CONFIG_TRACING_CPU_STATS option.
Transport Backends
The following backends are currently supported:
UART
USB
File (Using native posix port)
RTT (With SystemView)
Using Tracing
The sample samples/subsys/tracing demonstrates tracing with different formats and backends.
To get started, the simplest way is to use the CTF format with the native_posix
port, build the sample as follows:
Using west:
west build -b native_posix samples/subsys/tracing -- -DCONF_FILE=prj_native_posix_ctf.conf
Using CMake and ninja:
# Use cmake to configure a Ninja-based buildsystem:
cmake -B build -GNinja -DBOARD=native_posix -DCONF_FILE=prj_native_posix_ctf.conf samples/subsys/tracing

# Now run ninja on the generated build system:
ninja -C build
You can then run the resulting binary with the option -trace-file to generate
the tracing data:
mkdir data
cp $ZEPHYR_BASE/subsys/tracing/ctf/tsdl/metadata data/
./build/zephyr/zephyr.exe -trace-file=data/channel0_0
The resulting CTF output can be visualized using babeltrace or TraceCompass
by pointing the tool to the data directory with the metadata and trace files.
Visualisation Tools
TraceCompass
TraceCompass is an open source tool that visualizes CTF events such as thread scheduling and interrupts, and is helpful to find unintended interactions and resource conflicts on complex systems.
See also the presentation by Ericsson, Advanced Trouble-shooting Of Real-time Systems.
Future LTTng Inspiration
Currently, the top-layer provided here is quite simple and bare-bones, and needlessly copied from Zephyr’s Segger SystemView debug module.
For an OS like Zephyr, it would make sense to draw inspiration from Linux’s LTTng and change the top-layer to serialize to the same format. Doing this would enable direct reuse of TraceCompass’ canned analyses for Linux. Alternatively, LTTng-analyses in TraceCompass could be customized to Zephyr. It is ongoing work to enable TraceCompass visibility of Zephyr in a target-agnostic and open source way.
I/O Taxonomy
Atomic Push/Produce/Write/Enqueue:
- synchronous:
means data-transmission has completed with the return of the call.
- asynchronous:
means data-transmission is pending or ongoing with the return of the call. Usually, interrupts/callbacks/signals or polling is used to determine completion.
- buffered:
means data-transmissions are copied and grouped together to form a larger ones. Usually for amortizing overhead (burst dequeue) or jitter-mitigation (steady dequeue).
- Examples:
- sync unbuffered
E.g. PIO via GPIOs having steady stream, no extra FIFO memory needed. Low jitter but may be less efficient (cant amortize the overhead of writing).
- sync buffered
E.g.
fwrite()or enqueuing into FIFO. Blockingly burst the FIFO when its buffer-waterlevel exceeds threshold. Jitter due to bursts may lead to missed deadlines.
- async unbuffered
E.g. DMA, or zero-copying in shared memory. Be careful of data hazards, race conditions, etc!
- async buffered
E.g. enqueuing into FIFO.
Atomic Pull/Consume/Read/Dequeue:
- synchronous:
means data-reception has completed with the return of the call.
- asynchronous:
means data-reception is pending or ongoing with the return of the call. Usually, interrupts/callbacks/signals or polling is used to determine completion.
- buffered:
means data is copied-in in larger chunks than request-size. Usually for amortizing wait-time.
- Examples:
- sync unbuffered
E.g. Blocking read-call,
fread()or SPI-read, zero-copying in shared memory.
- sync buffered
E.g. Blocking read-call with caching applied. Makes sense if read pattern exhibits spatial locality.
- async unbuffered
E.g. zero-copying in shared memory. Be careful of data hazards, race conditions, etc!
- async buffered
E.g.
aio_read()or DMA.
Unfortunately, I/O may not be atomic and may, therefore, require locking. Locking may not be needed if multiple independent channels are available.
- The system has non-atomic write and one shared channel
E.g. UART. Locking required.
lock(); emit(a); emit(b); emit(c); release();
- The system has non-atomic write but many channels
E.g. Multi-UART. Lock-free if the bottom-layer maps each Zephyr thread+ISR to its own channel, thus alleviating races as each thread is sequentially consistent with itself.
emit(a,thread_id); emit(b,thread_id); emit(c,thread_id);
- The system has atomic write but one shared channel
E.g.
native_posixor board with DMA. May or may not need locking.
emit(a ## b ## c); /* Concat to buffer */
lock(); emit(a); emit(b); emit(c); release(); /* No extra mem */
- The system has atomic write and many channels
E.g. native_posix or board with multi-channel DMA. Lock-free.
emit(a ## b ## c, thread_id);