Profiler
The Profiler provides an interface for logging and visualizing data for performance measurements, while the system is running. You can use the module to profile Application Event Manager events or custom events. The output is provided using RTT and can be visualized in a custom Python backend.
See the Profiler sample for an example of how to use the Profiler.
Configuration
Since Application Event Manager events are converted to profiler events, the Profiler can be configured to profile custom events or Application Event Manager events, or both.
Configuring for use with custom events
To use the Profiler for custom events, complete the following steps:
Enable the
CONFIG_PROFILERKconfig option. This option adds the Profiler source code to the application.Call
profiler_init()during the application start to initialize the Profiler.Profile custom events, as described in the following section.
Profiling custom events
To profile custom events, complete the following steps:
Register the custom events using
profiler_register_event_type(). The following code example shows how to register event types:static const char * const data_names[] = {"value1", "value2", "value3", "value4", "string"}; static const enum profiler_arg data_types[] = {PROFILER_ARG_U32, PROFILER_ARG_S32, PROFILER_ARG_S16, PROFILER_ARG_U8, PROFILER_ARG_STRING}; no_data_event_id = profiler_register_event_type("no_data_event", NULL, NULL, 0); data_event_id = profiler_register_event_type("data_event", data_names, data_types, 5);
Add a structure for sending information about event occurrences:
Add the following mandatory functions to the structure:
profiler_log_start()- Start logging.profiler_log_send()- Send profiled data.
Add one or more of the following optional functions in-between the mandatory functions, depending on the data format:
profiler_log_encode_uint32()- Add 32-bit unsigned integer connected with the event.profiler_log_encode_int32()- Add 32-bit integer connected with the event.profiler_log_encode_uint16()- Add 16-bit unsigned integer connected with the event.profiler_log_encode_int16()- Add 16-bit integer connected with the event.profiler_log_encode_uint8()- Add 8-bit unsigned integer connected with the event.profiler_log_encode_int8()- Add 8-bit integer connected with the event.profiler_log_encode_string()- Add string connected with the event.
Wrap the calls in one function that you then call to profile event occurrences. The following code example shows a function for profiling an event with data:
static void profile_data_event(uint32_t val1, int32_t val2, int16_t val3,
            uint8_t val4, const char *string)
{
  struct log_event_buf buf;

  profiler_log_start(&buf);
  /* Profiling data connected with an event */
  profiler_log_encode_uint32(&buf, val1);
  profiler_log_encode_int32(&buf, val2);
  profiler_log_encode_int16(&buf, val3);
  profiler_log_encode_uint8(&buf, val4);
  profiler_log_encode_string(&buf, string);
  profiler_log_send(&buf, data_event_id);
}
Note
The
data_event_idand the data that is profiled with the event must be consistent with the registered event type. The data for every data field must be provided in the correct order.
Configuration for use with Application Event Manager
If you are using the Application Event Manager, in order to use the Profiler follow the steps in Implementing profiling for Application Event Manager events and Configuration on the Application Event Manager profiler tracer documentation page.
Enabling supported backend
The Profiler supports a custom backend that is based around Python scripts to visualize the output data. The backend communicates with the host using RTT.
To save profiling data, the scripts use CSV files for event occurrences and JSON files for event descriptions.
Available scripts
The scripts can be found under scripts/profiler/ in the nRF Connect SDK folder structure.
The following script files are available:
data_collector.py- This script connects to the device using RTT, receives profiling data, and saves it to files. When running the script from the command line, provide the time for collecting data (in seconds) and the dataset name. For example:python3 data_collector.py 5 test1
In this command,
5is the time value for collecting data andtest1is the dataset name.plot_from_files.py- This script plots events from the dataset that is provided as the command-line argument. For example:python3 plot_from_files.py test1
In this command,
test1is the dataset name.real_time_plot.py- This script connects to the device using RTT, plots data in real-time, and saves the data. When running the script from the command line, provide the dataset name. For example:python3 real_time_plot.py test1
merge_data.py- This script combines data fromtest_pandtest_cdatasets into one datasettest_merged. It also provides clock drift compensation based on the synchronization events:sync_event_pandsync_event_c. This enables you to observe times between events for the two connected devices. As command-line arguments, provide names of events used for synchronization for a Peripheral (sync_event_p) and a Central (sync_event_c), as well as names of datasets for the Peripheral (test_p), the Central (test_c), and the merge result (test_merged). For example:python3 merge_data.py test_p sync_event_p test_c sync_event_c test_merged
Running the backend
To enable and run the custom backend, complete the following steps:
Connect device to the computer.
Complete the configuration steps for use with either custom events or Application Event Manager, as described in the Configuration section.
From the list of Available scripts, choose the Python script that you want to use for event visualization, analysis, and calculating statistics.
Run the script from the command line using its related command.
Backend visualization
When you run either the plot_from_files.py or the real_time_plot.py script, the profiled events are visualized in a GUI window.
The visual output can look like the following diagram:
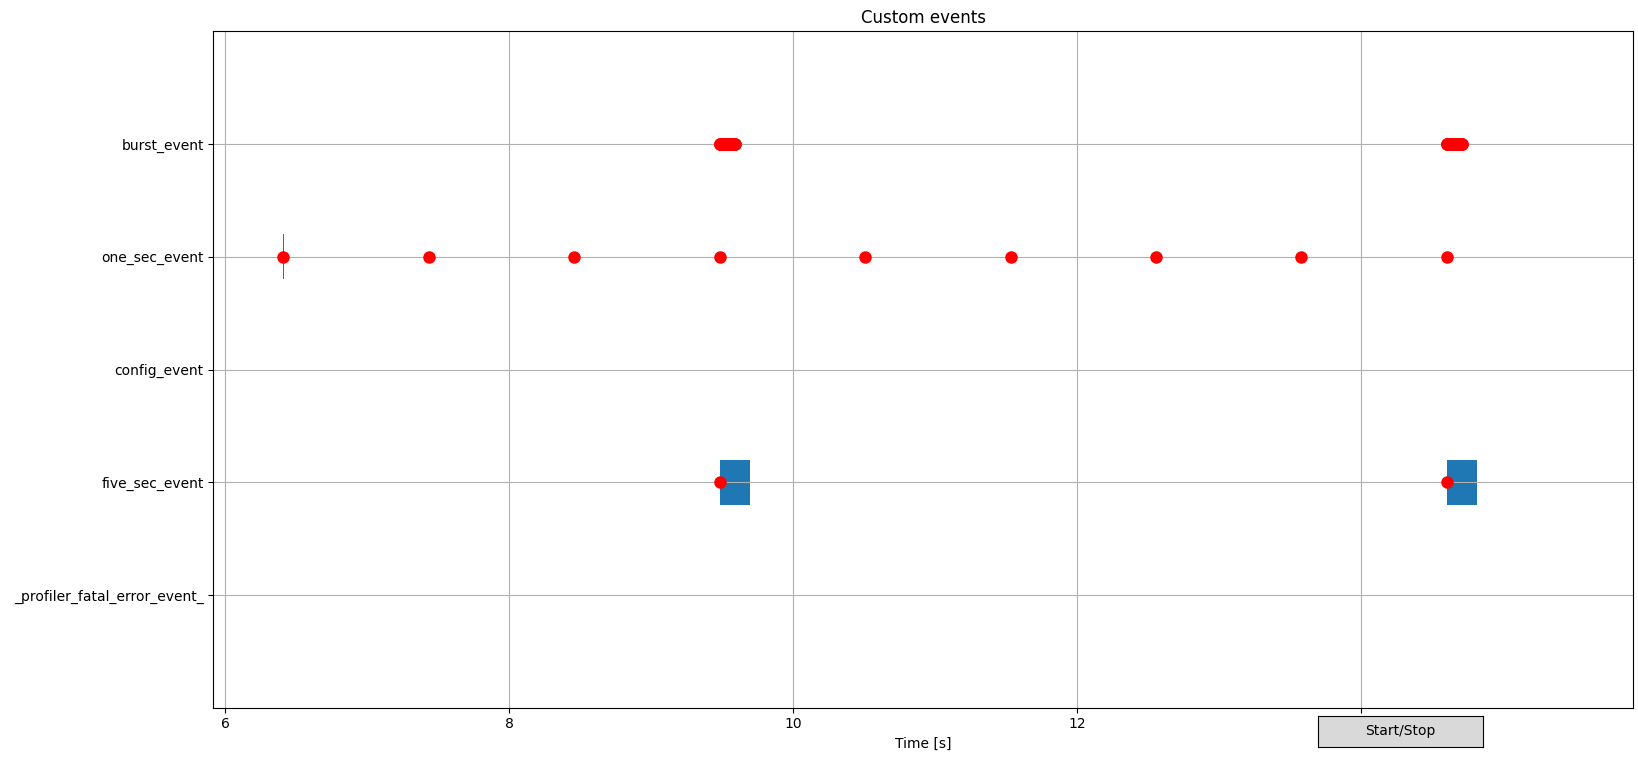
Example of profiler backend script visualization
In this diagram:
Red dots indicate the submissions for the related events.
Blue vertical rectangles indicate the processing of the events, with their width corresponding to the processing time length.
The Start/Stop button can be used to pause or resume the real-time plot translation.
The GUI also supports the following actions:
Scrolling on the diagam using the mouse wheel can zoom the diagram in or out.
When plotting is paused, scrolling zooms to the cursor location.
When plotting in running, scrolling zooms to the right edge of the plot.
Middle mouse button can be used to mark an event submission or processing for tracking, and to display the event data.
When plotting is paused, you can click and drag with the left mouse button to pan the plot.
You can click the left or right mouse button to place a vertical line at the cursor location. When two lines are present, the application measures the time between them and displays it.
Shell integration
The Profiler is integrated with Zephyr’s Shell module. When the shell is turned on, an additional subcommand set (profiler) is added.
This subcommand set contains the following commands:
- list
Show a list of profiled event types. The letters “E” or “D” indicate if profiling is currently enabled or disabled for a given event type.
- enable or disable
Enable or disable profiling. If called without additional arguments, the command applies to all event types. To enable or disable profiling for specific event types, pass the event type indexes (as displayed by list) as arguments.
API documentation
include/profiler.hsubsys/profiler/- group profiler
Profiler.
Defines
-
CONFIG_PROFILER_MAX_NUMBER_OF_APP_EVENTS
Maximum number of events.
-
CONFIG_PROFILER_NUMBER_OF_INTERNAL_EVENTS
Number of internal events.
-
PROFILER_MAX_NUMBER_OF_APPLICATION_AND_INTERNAL_EVENTS
Maximum number of events including user application events and internal events.
Enums
Functions
-
int profiler_init(void)
Initialize the Profiler.
Warning
This function is thread-safe, but not safe to use in interrupts.
- Return values
0 – If the operation was successful.
-
void profiler_term(void)
Terminate the Profiler.
-
const char *profiler_get_event_descr(size_t profiler_event_id)
Retrieve the description of an event type.
- Parameters
profiler_event_id – Event ID.
- Returns
Event description.
-
static inline bool is_profiling_enabled(size_t profiler_event_id)
Check if profiling is enabled for a given event type.
- Parameters
profiler_event_id – Event ID.
- Returns
Logical value indicating if the event type is currently profiled.
-
uint16_t profiler_register_event_type(const char *name, const char *const *args, const enum profiler_arg *arg_types, uint8_t arg_cnt)
Register an event type.
Warning
This function is thread-safe, but not safe to use in interrupts.
- Parameters
name – Name of the event type.
args – Names of data values sent with the event.
arg_types – Types of data values sent with the event.
arg_cnt – Number of data values sent with the event.
- Returns
ID assigned to the event type.
-
void profiler_log_start(struct log_event_buf *buf)
Initialize a buffer for the data of an event.
- Parameters
buf – Pointer to the data buffer.
-
void profiler_log_encode_uint32(struct log_event_buf *buf, uint32_t data)
Encode and add uint32_t data type to a buffer.
Warning
The buffer must be initialized with profiler_log_start before calling this function.
- Parameters
buf – Pointer to the data buffer.
data – Data to add to the buffer.
-
void profiler_log_encode_int32(struct log_event_buf *buf, int32_t data)
Encode and add int32_t data type to a buffer.
Warning
The buffer must be initialized with profiler_log_start before calling this function.
- Parameters
buf – Pointer to the data buffer.
data – Data to add to the buffer.
-
void profiler_log_encode_uint16(struct log_event_buf *buf, uint16_t data)
Encode and add uint16_t data type to a buffer.
Warning
The buffer must be initialized with profiler_log_start before calling this function.
- Parameters
buf – Pointer to the data buffer.
data – Data to add to the buffer.
-
void profiler_log_encode_int16(struct log_event_buf *buf, int16_t data)
Encode and add int16_t data type to a buffer.
Warning
The buffer must be initialized with profiler_log_start before calling this function.
- Parameters
buf – Pointer to the data buffer.
data – Data to add to the buffer.
-
void profiler_log_encode_uint8(struct log_event_buf *buf, uint8_t data)
Encode and add uint8_t data type to a buffer.
Warning
The buffer must be initialized with profiler_log_start before calling this function.
- Parameters
buf – Pointer to the data buffer.
data – Data to add to the buffer.
-
void profiler_log_encode_int8(struct log_event_buf *buf, int8_t data)
Encode and add int8_t data type to a buffer.
Warning
The buffer must be initialized with profiler_log_start before calling this function.
- Parameters
buf – Pointer to the data buffer.
data – Data to add to the buffer.
-
void profiler_log_encode_string(struct log_event_buf *buf, const char *string)
Encode and add string to a buffer.
Maximum 255 characters can be sent (the rest is ommited).
Warning
The buffer must be initialized with profiler_log_start before calling this function.
- Parameters
buf – Pointer to the data buffer.
string – String to add to the buffer.
-
void profiler_log_add_mem_address(struct log_event_buf *buf, const void *mem_address)
Encode and add the event’s address in memory to the buffer.
This information is used for event identification.
Warning
The buffer must be initialized with profiler_log_start before calling this function.
- Parameters
buf – Pointer to the data buffer.
mem_address – Memory address to encode.
-
void profiler_log_send(struct log_event_buf *buf, uint16_t event_type_id)
Send data from the buffer to the host.
This function only sends data that is already stored in the buffer. Use profiler_log_encode_uint32, profiler_log_encode_int32, profiler_log_encode_uint16, profiler_log_encode_int16, profiler_log_encode_uint8, profiler_log_encode_int8, profiler_log_encode_string or profiler_log_add_mem_address to add data to the buffer.
- Parameters
event_type_id – Event type ID as assigned to the event type when it is registered.
buf – Pointer to the data buffer.
Variables
-
uint8_t profiler_num_events
Number of event types registered in the Profiler.
-
struct profiler_event_enabled_bm
- #include <profiler.h>
Bitmask indicating event is enabled. This structure is private to profiler and should not be referred from outside.
-
struct log_event_buf
- #include <profiler.h>
Buffer required for data that is sent with the event.
-
CONFIG_PROFILER_MAX_NUMBER_OF_APP_EVENTS