Application Event Manager profiling tracer
The Application Event Manager profiling tracer sample demonstrates the functionality of profiling Application Event Manager events using the nRF Profiler and the Application Event Manager profiler tracer modules.
Requirements
The sample supports the following development kits:
Hardware platforms |
PCA |
Board name |
Build target |
|---|---|---|---|
PCA10090 |
|
||
PCA10040 |
|
||
PCA10056 |
|
||
PCA10112 |
|
When built for an _ns build target, the sample is configured to compile and run as a non-secure application with Cortex-M Security Extensions enabled.
Therefore, it automatically includes Trusted Firmware-M that prepares the required peripherals and secure services to be available for the application.
Overview
The sample application consists of the following modules that communicate using events:
Module A (
module_a.c)Module B (
module_b.c)
Module A waits for a configuration event sent by main.c.
After receiving this event, Module A starts sending periodic events every second to Module B.
Module A also has a counter that increases before a one_sec_event is sent.
The counter value is transmitted during the event.
Module B waits for the one_sec_event events from Module A.
Every time it receives a one_sec_event, the module checks if the value it transmits is equal to 5.
If it is equal to 5, Module B sends a five_sec_event to Module A.
When Module A receives a five_sec_event from Module B, it zeros the counter, sends a series of 50 burst_event, and simulates work for 100 ms by busy waiting.
![msc {
hscale = "1.3";
Main [label="main.c"],ModA [label="Module A"],ModB [label="Module B"];
Main>>ModA [label="Configuration event"];
ModA rbox ModA [label="Increases the counter"];
ModA>>ModB [label="One-second event, counter value 1"];
ModB rbox ModB [label="Checks the counter"];
ModA rbox ModA [label="Increases the counter"];
ModA>>ModB [label="One-second event, counter value 2"];
ModB rbox ModB [label="Checks the counter"];
|||;
...;
...;
|||;
ModA rbox ModA [label="Increases the counter"];
ModA>>ModB [label="One-second event, counter value 5"];
ModB rbox ModB [label="Checks the counter\nCounter value matches 5"];
ModA<<ModB [label="Five-second event"];
ModA rbox ModA [label="Zeroes the counter\nSends 50 burst events\nSimulates work for 100 ms"];
}](../../_images/mscgen-5c18001b44a773a2718460cb666e49c687186600.png)
Configuration
See Configuring and building an application for information about how to permanently or temporarily change the configuration.
Building and running
This sample can be found under samples/app_event_manager_profiler_tracer in the nRF Connect SDK folder structure.
When built as firmware image for the _ns build target, the sample has Cortex-M Security Extensions (CMSE) enabled and separates the firmware between Non-Secure Processing Environment (NSPE) and Secure Processing Environment (SPE).
Because of this, it automatically includes the Trusted Firmware-M (TF-M).
To read more about CMSE, see Processing environments.
To build the sample with Visual Studio Code, follow the steps listed on the How to build an application page in the nRF Connect for VS Code extension documentation. See Configuring and building an application for other building scenarios, Programming an application for programming steps, and Testing and optimization for general information about testing and debugging in the nRF Connect SDK.
Testing
After programming the sample to your development kit, test it by performing the following steps:
Run the script
real_time_plot.pylocated in thescripts/nrf_profilerfolder, with the name that is to be used to store the data as argument. For example, run the following command to generate atest_name.csvand atest_name.jsonfile using the test_name argument:real_time_plot.py test_name
The script opens a GUI window that displays events as points on timelines, similar to the following:
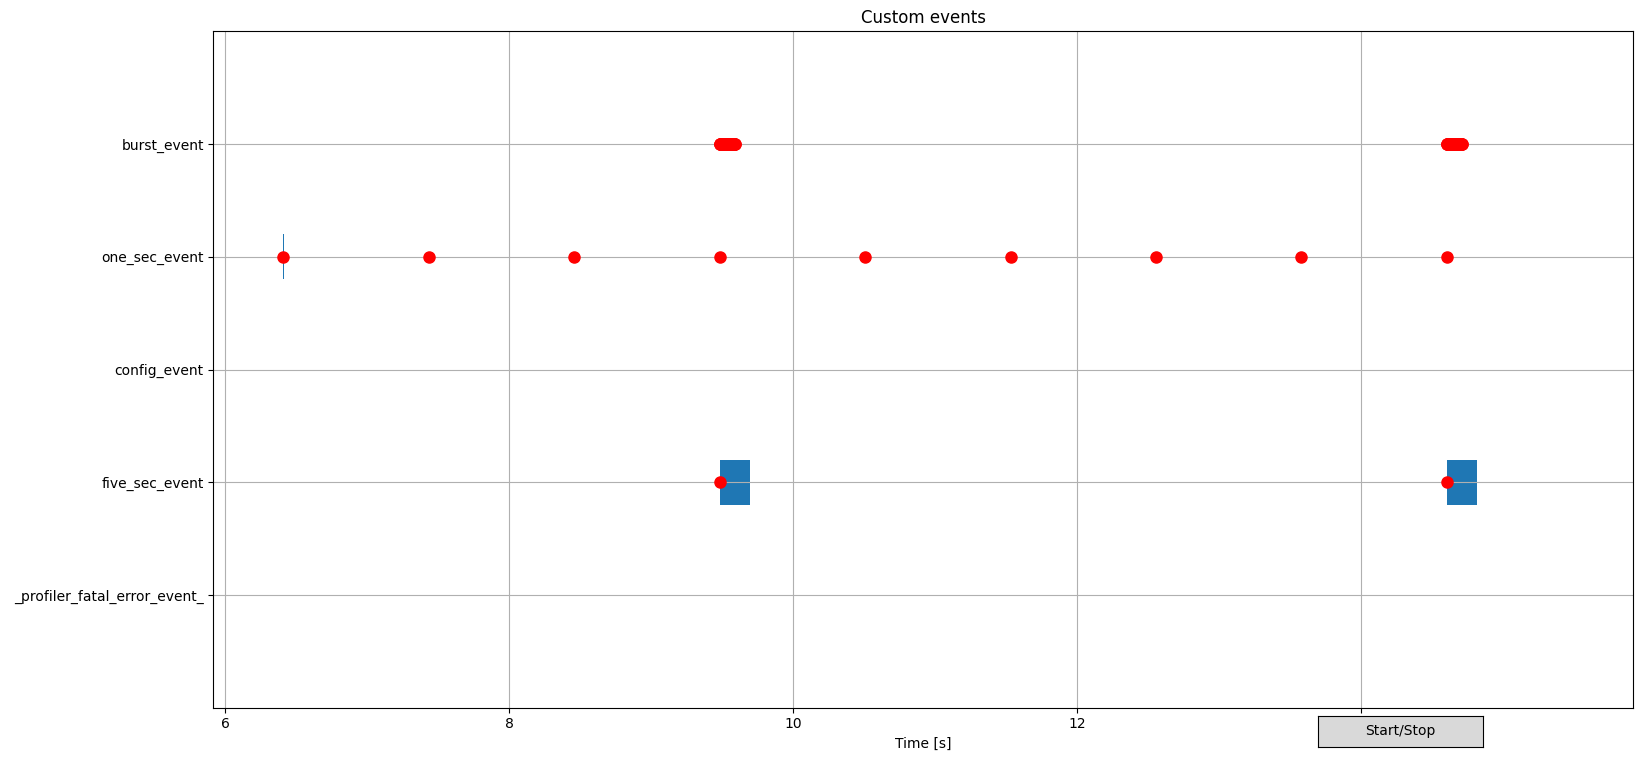
Example of nRF Profiler backend script visualization
Use scroll wheel to zoom into interesting parts on a GUI. See the Backend visualization in the Profiler documentation for more information about how to work with the diagram.
Click the middle mouse button to highlight an event submission or processing for tracking, and to display the event data as on a figure:
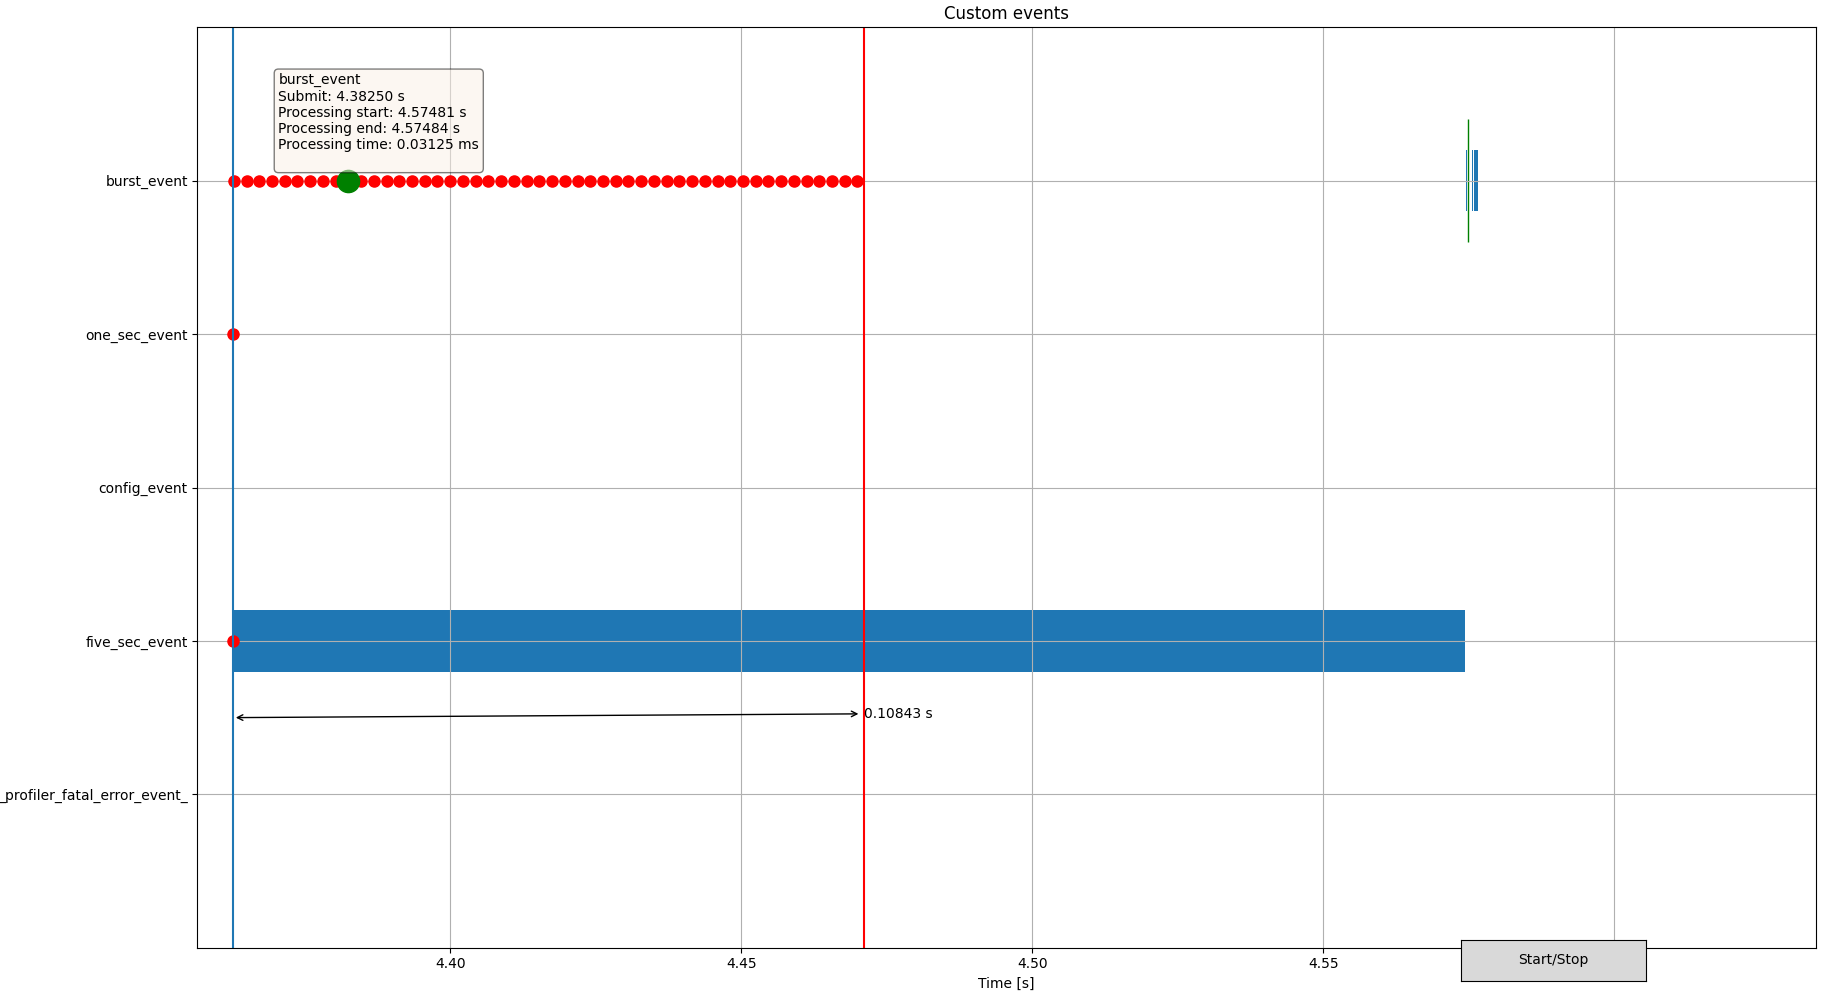
Sample diagram of zoomed-in GUI output
On this image, the zoom focuses on actions triggered by the fifth one-second event. The five-second event triggers 50 burst events. One event submission and corresponding processing time is highlighted in green.
Check the results for the generated
test_name.csvandtest_name.jsonfiles.See how events are logged with data transmitted by the event.
Dependencies
This sample uses the following nRF Connect SDK subsystems:
In addition, it uses the following Zephyr subsystems:
The sample also uses the following secure firmware component: